Dear readers,
A couple of weeks ago we performed a series of engine tests prior to the flight of Nexø II. In spite of a minor error, we approved the Engine Controller and its code for flight, but what about those TEOS tests, how did that actually work out?
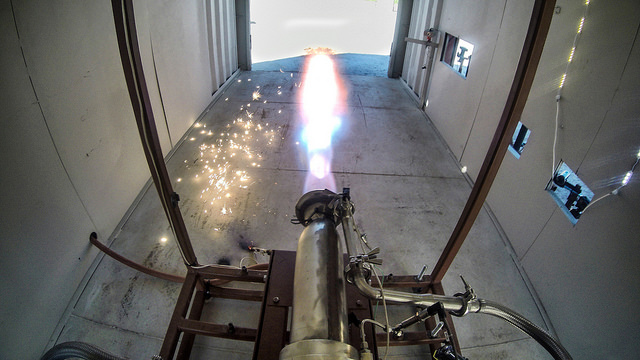
Nexø II spare engine at full thrust during the static test. Photo: Carsten Olsen.
As written in a previous blog, we performed a total of five tests on the day, all with different fuels to both see the effect of lowering the water content and the effect of adding TEOS. The fuel used in the five tests was:
1) 75% ethanol
2) 85% ethanol
3) 92.5% ethanol
4) 91.5% ethanol + 1% TEOS
5) 74% ethanol + 1% TEOS
For readers who may not read on all blogs, I will just briefly refresh what the TEOS expects to result in. TEOS produces a layer of amorphous silica at high temperature. If you burn it in a rocket engine, you’ll get a coating on the inside of the combustion chamber and nozzle. Since it has a very low thermal conduction coefficient, it reduces heat transfer from the combustion gases to the combustion chamber itself and thus the motor will be stressed less than otherwise. It may thus extend the design space slightly with regard to mechanical strength of the actual combustion chamber.
Before we look at data, I will just show the immediate visual effect of running with TEOS. The picture below is taken after the last TEOS test. As seen, the inside of the engine and nozzle is covered by a fine white layer of silicon dioxide.
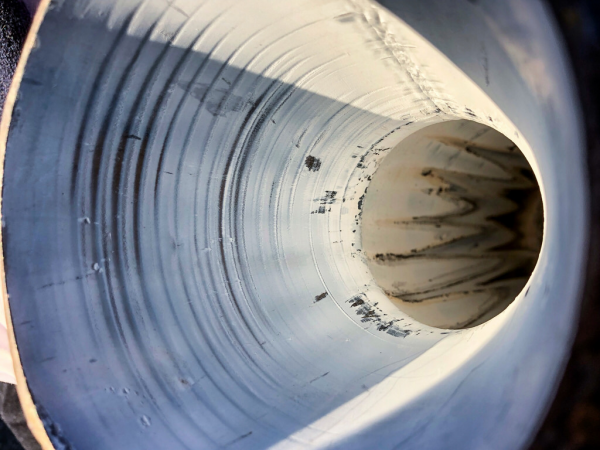
After a 1% TEOS run, the engine is coated with a fine layer of SiO2. Foto: Carsten Olsen.
I’ve been wondering about a nice and easy way to present the data from all five tests… but I have not really found that. Thus, I will simply throw in all approx. 1 million data points in the form of five times 12 graphs with engine data.
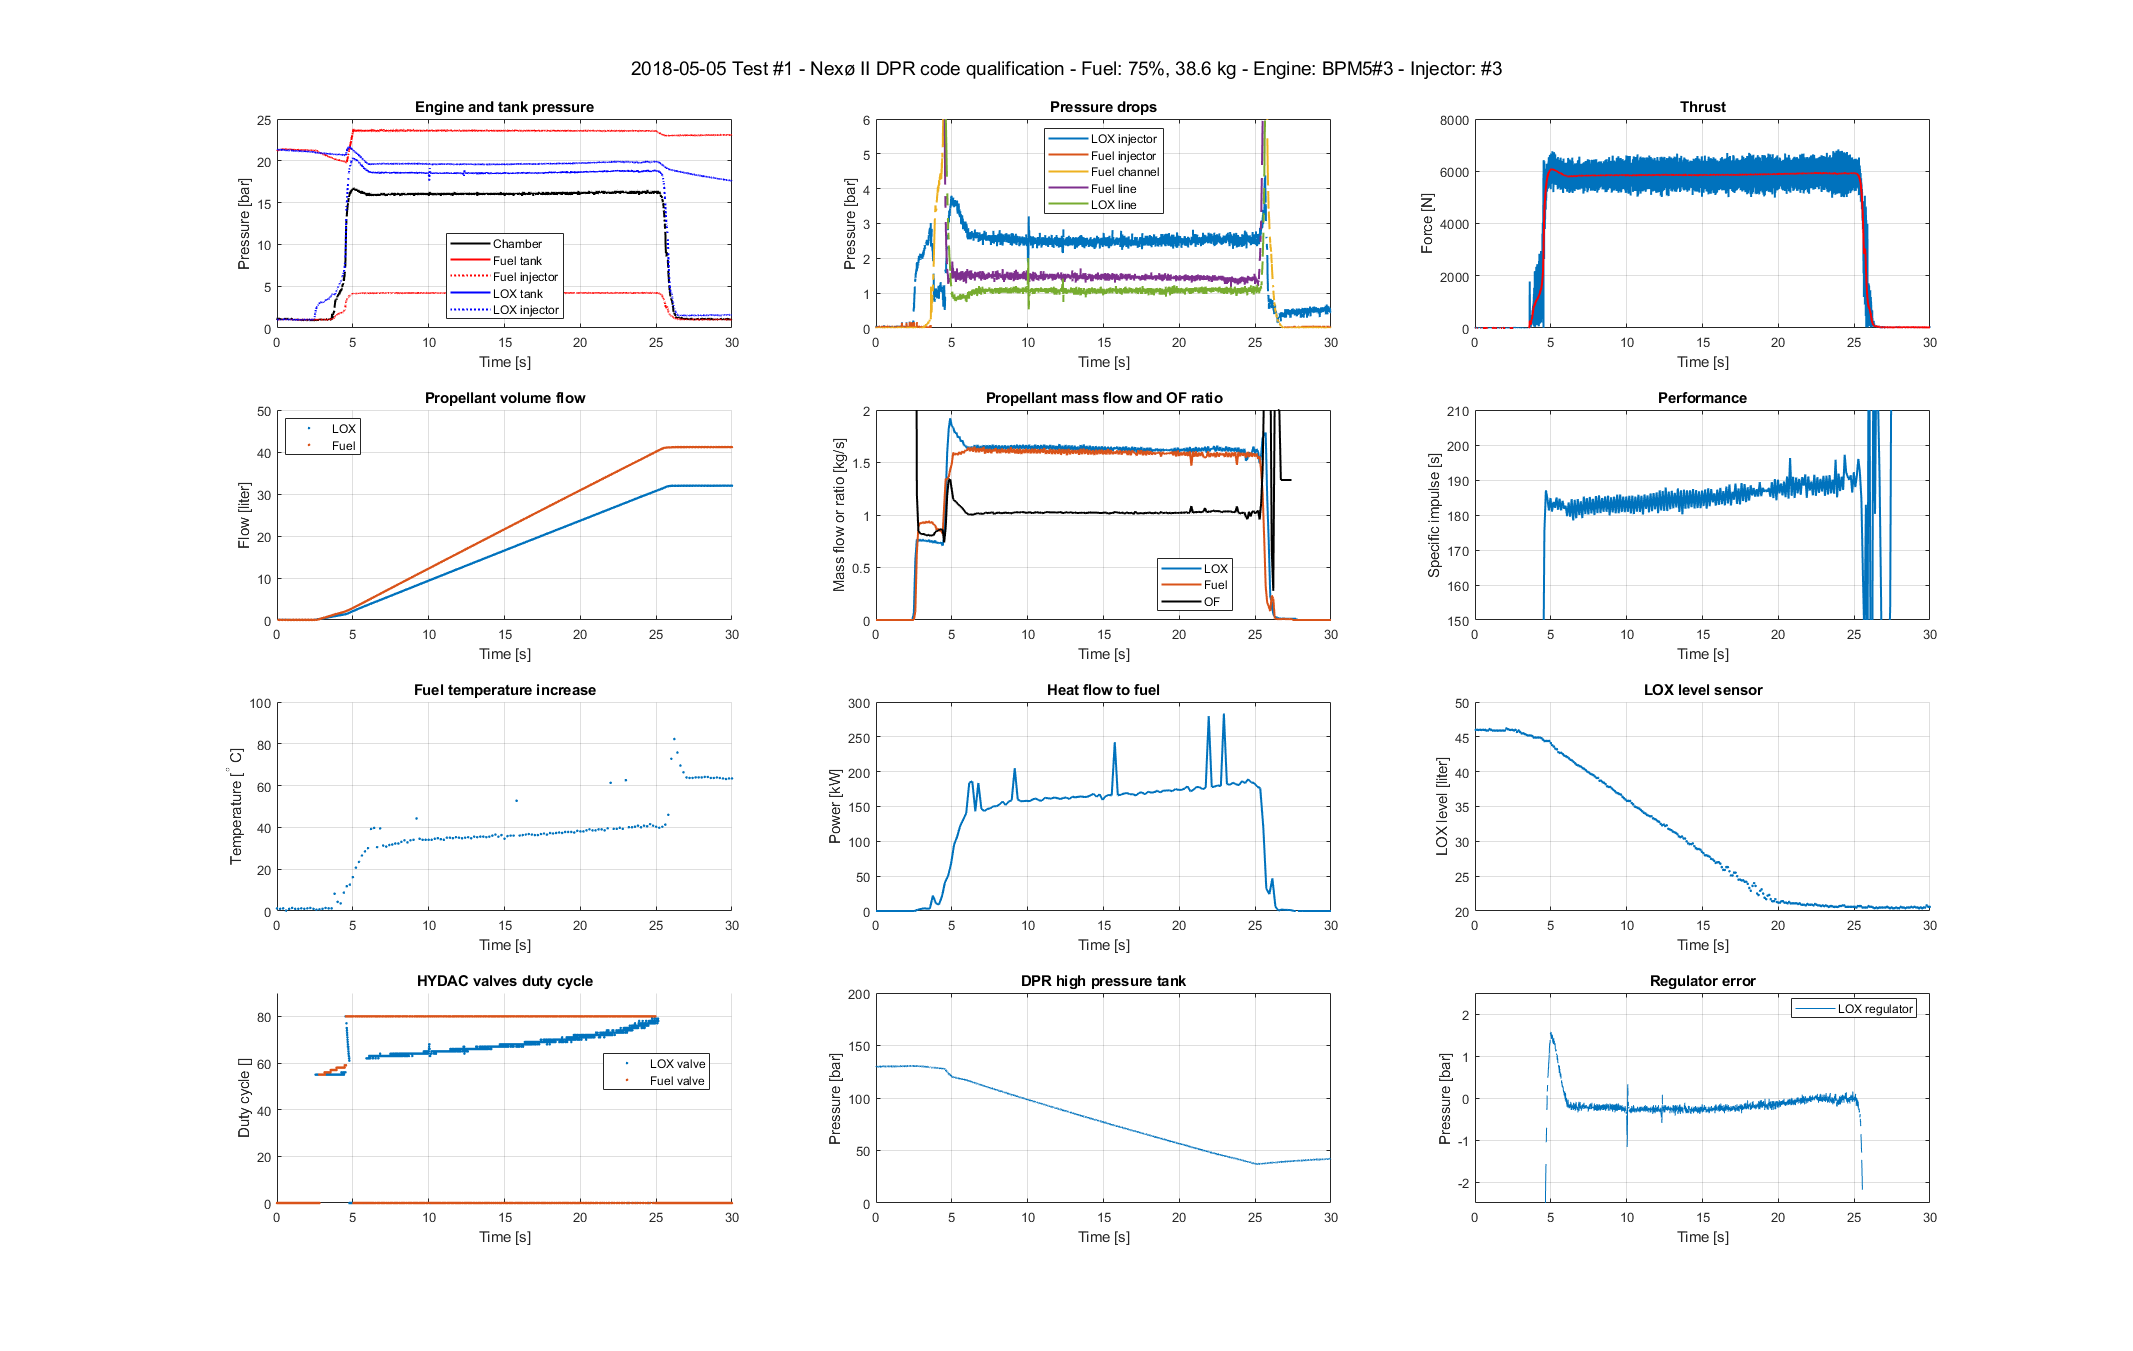
Engine data from Test # 1 with 75% ethanol.
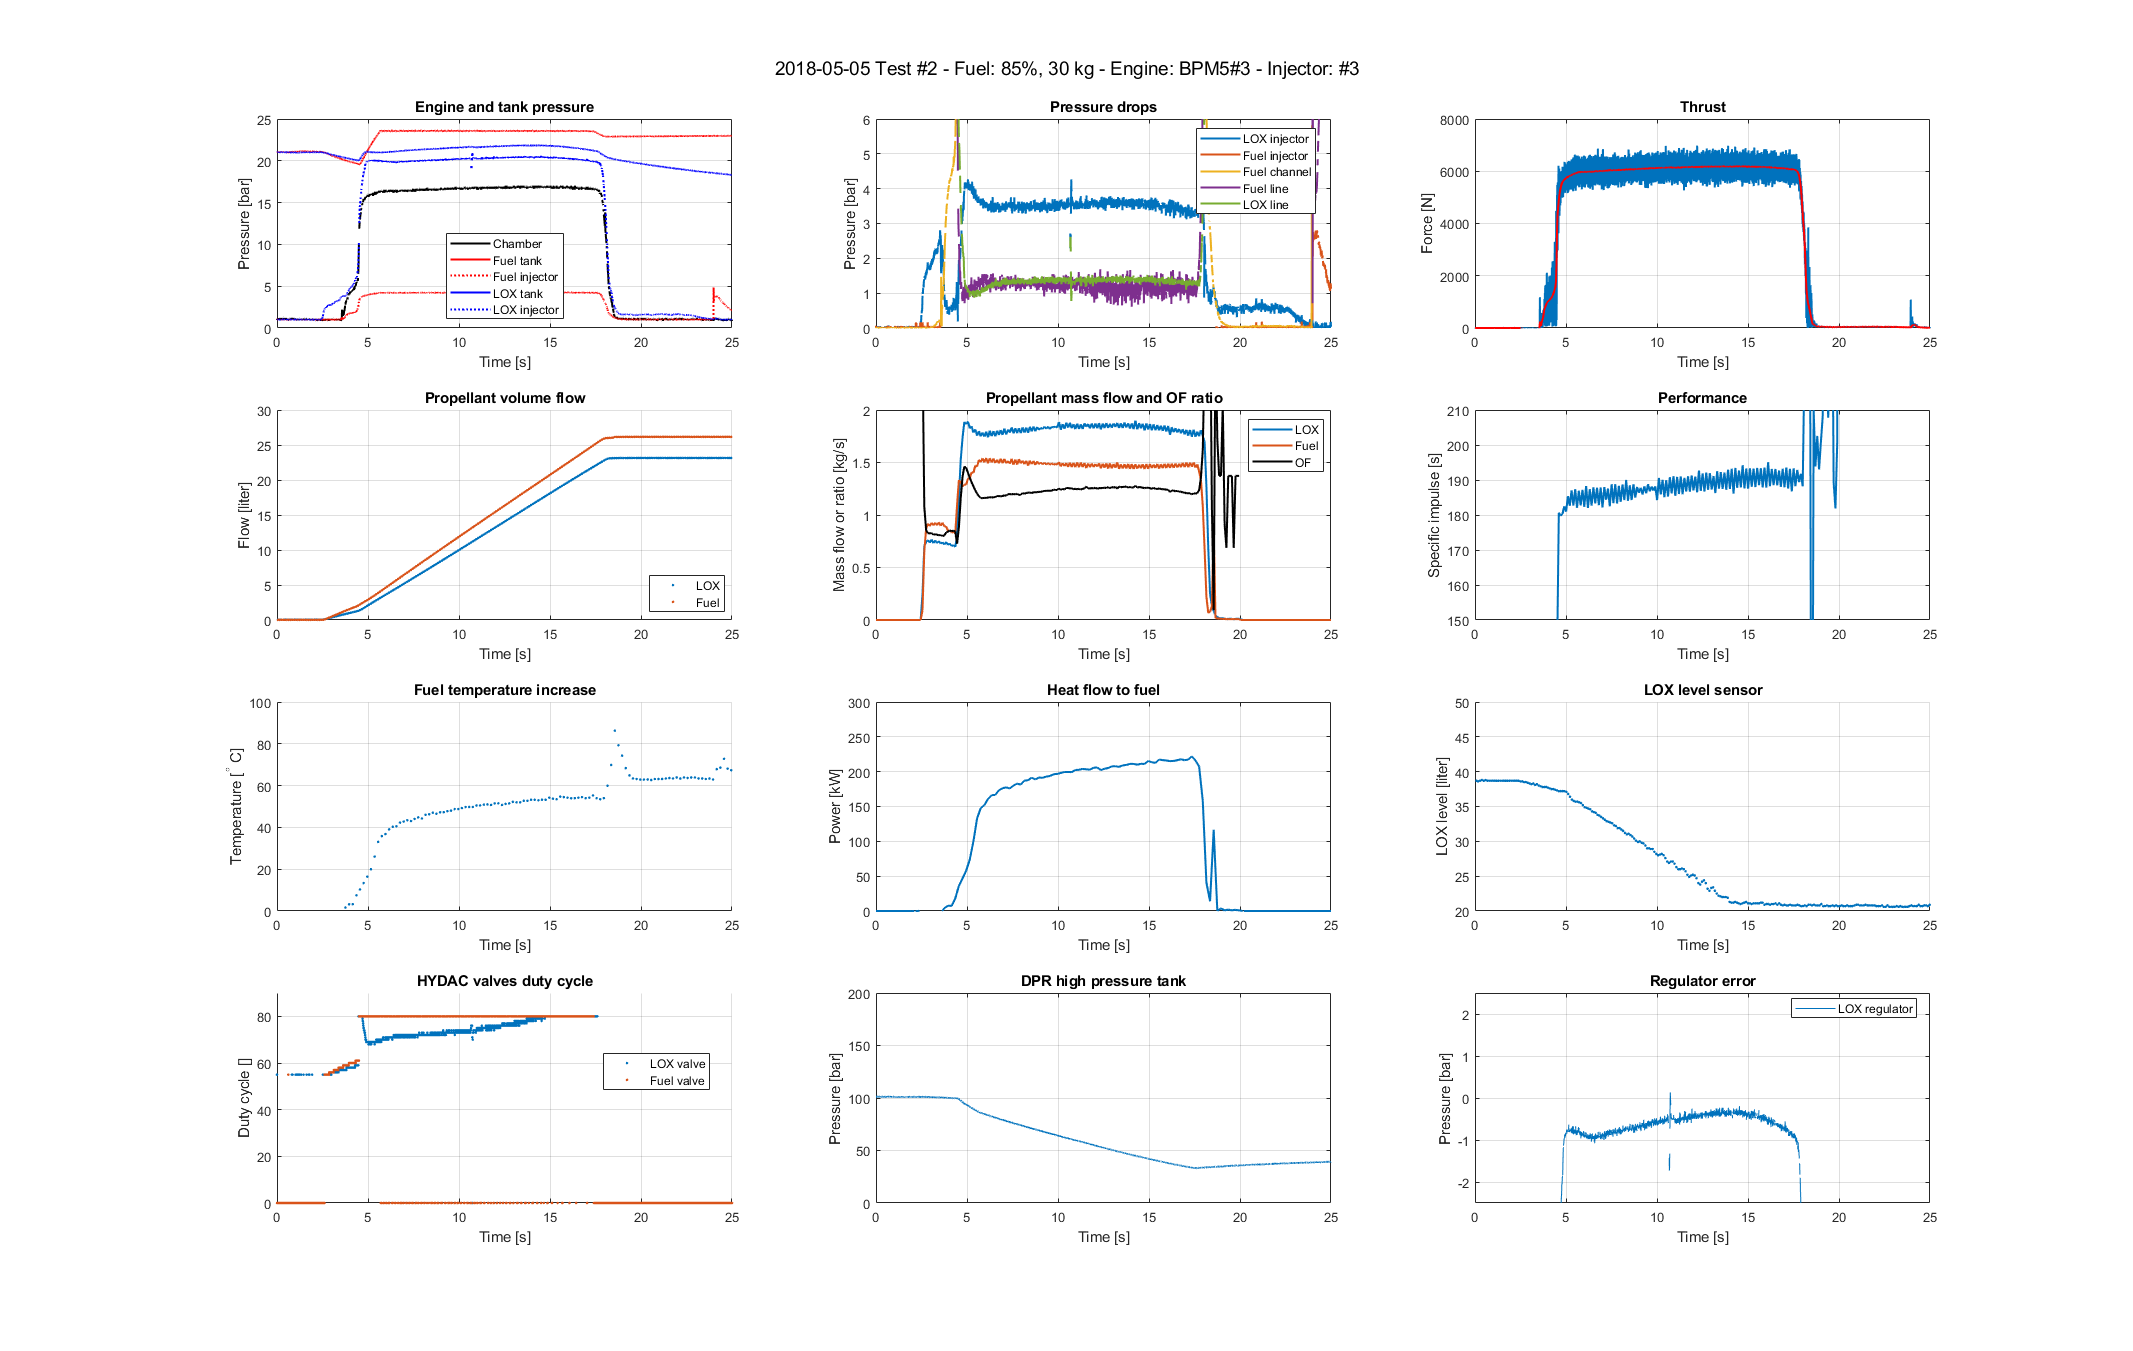
Engine data from Test # 2 with 85% ethanol.
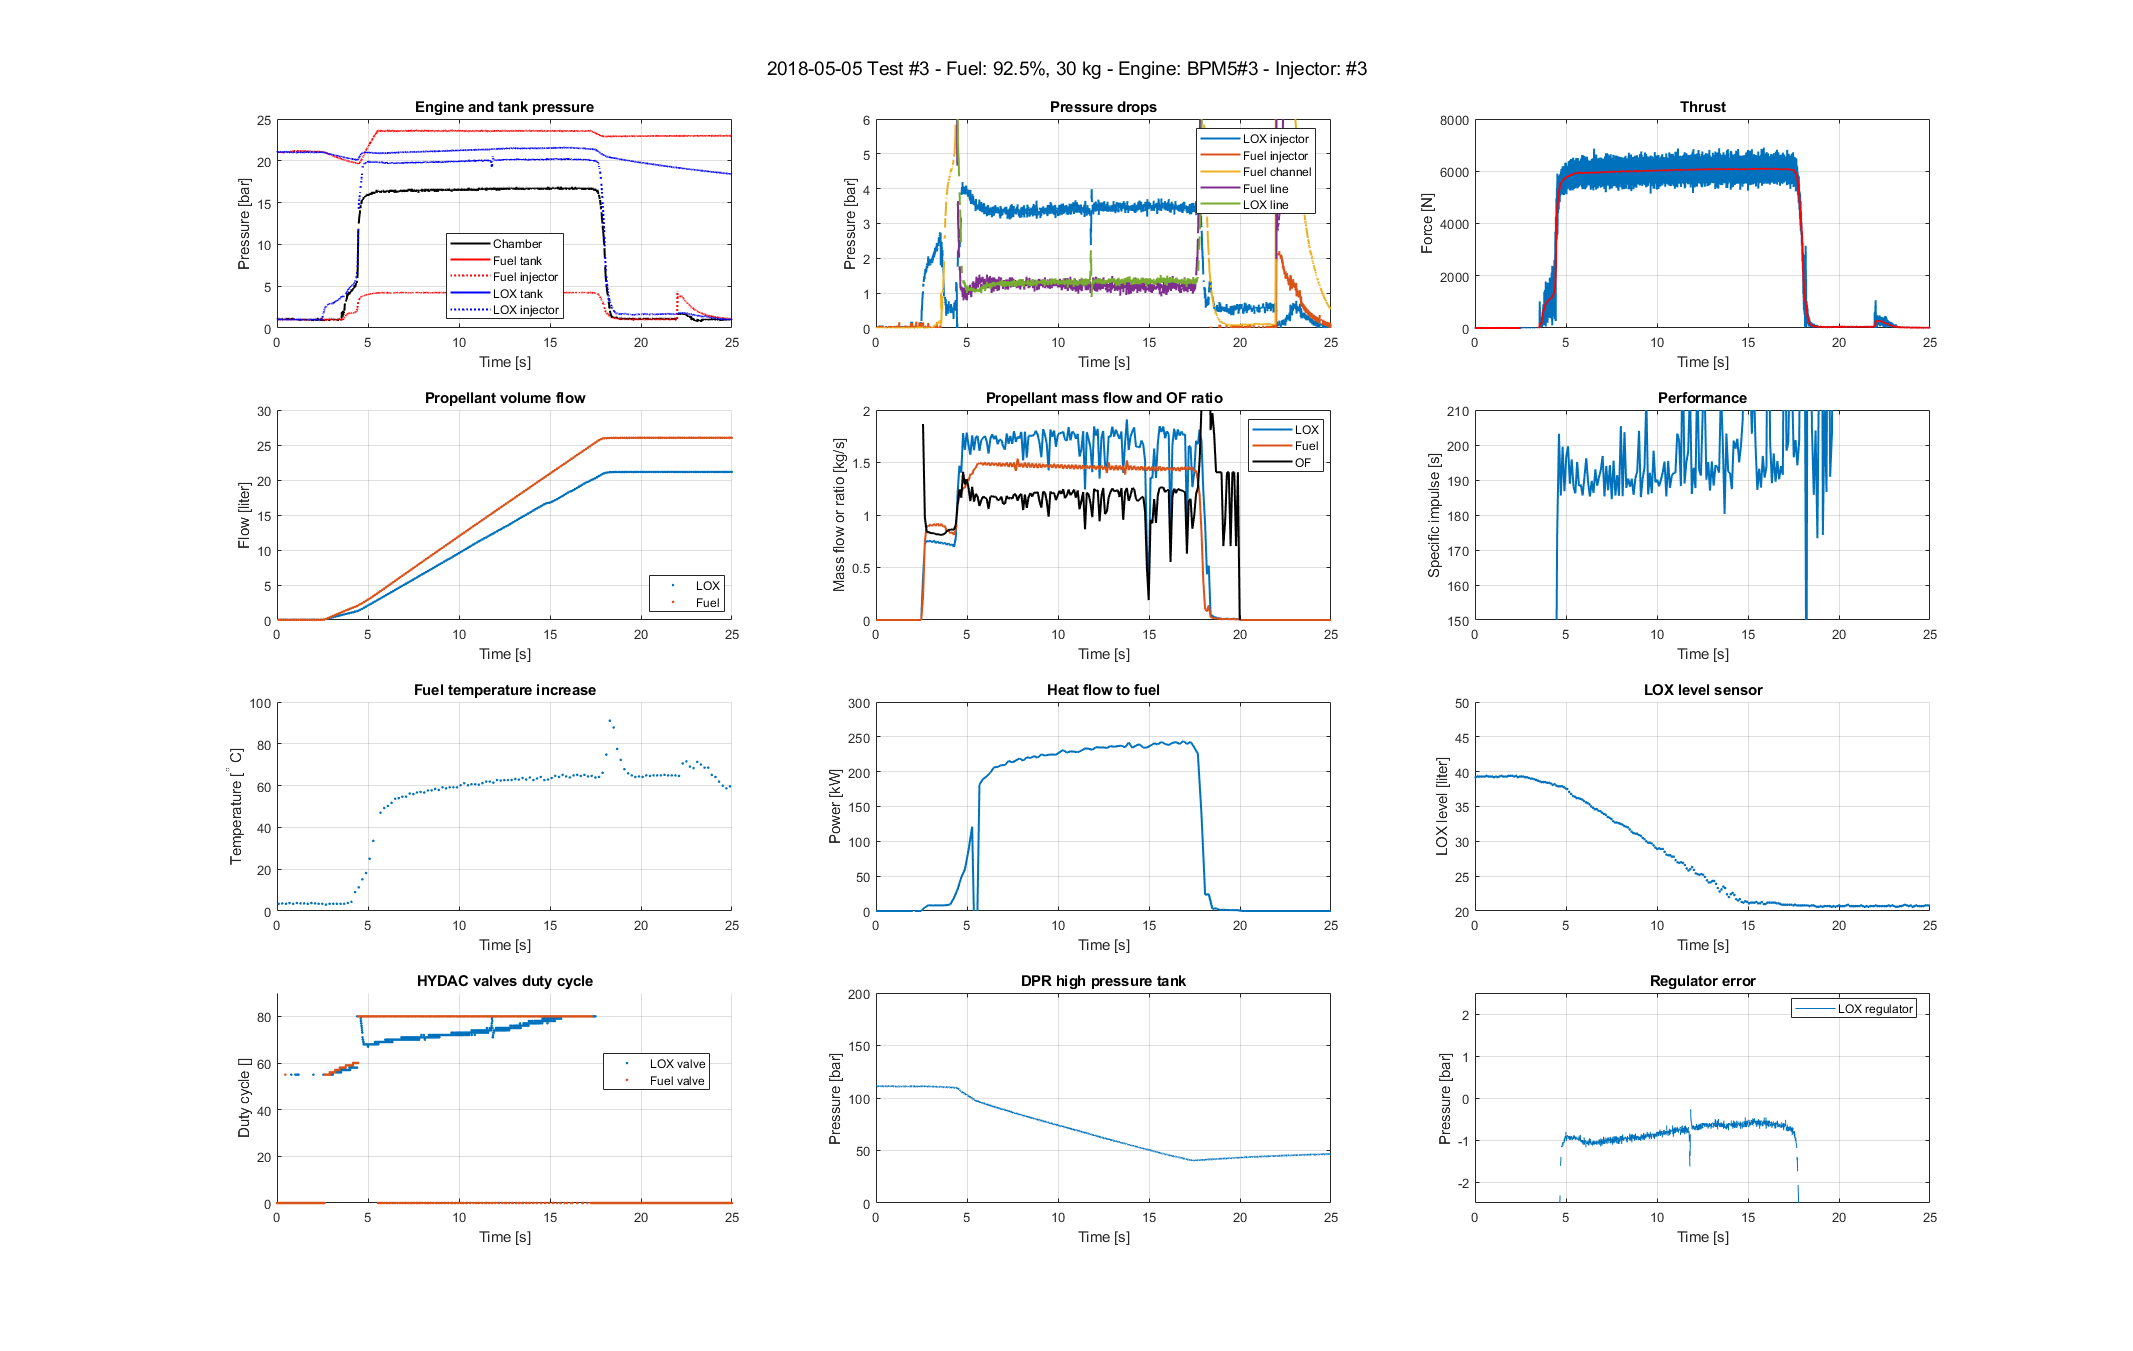
Engine data from Test # 3 with 92.5% ethanol.
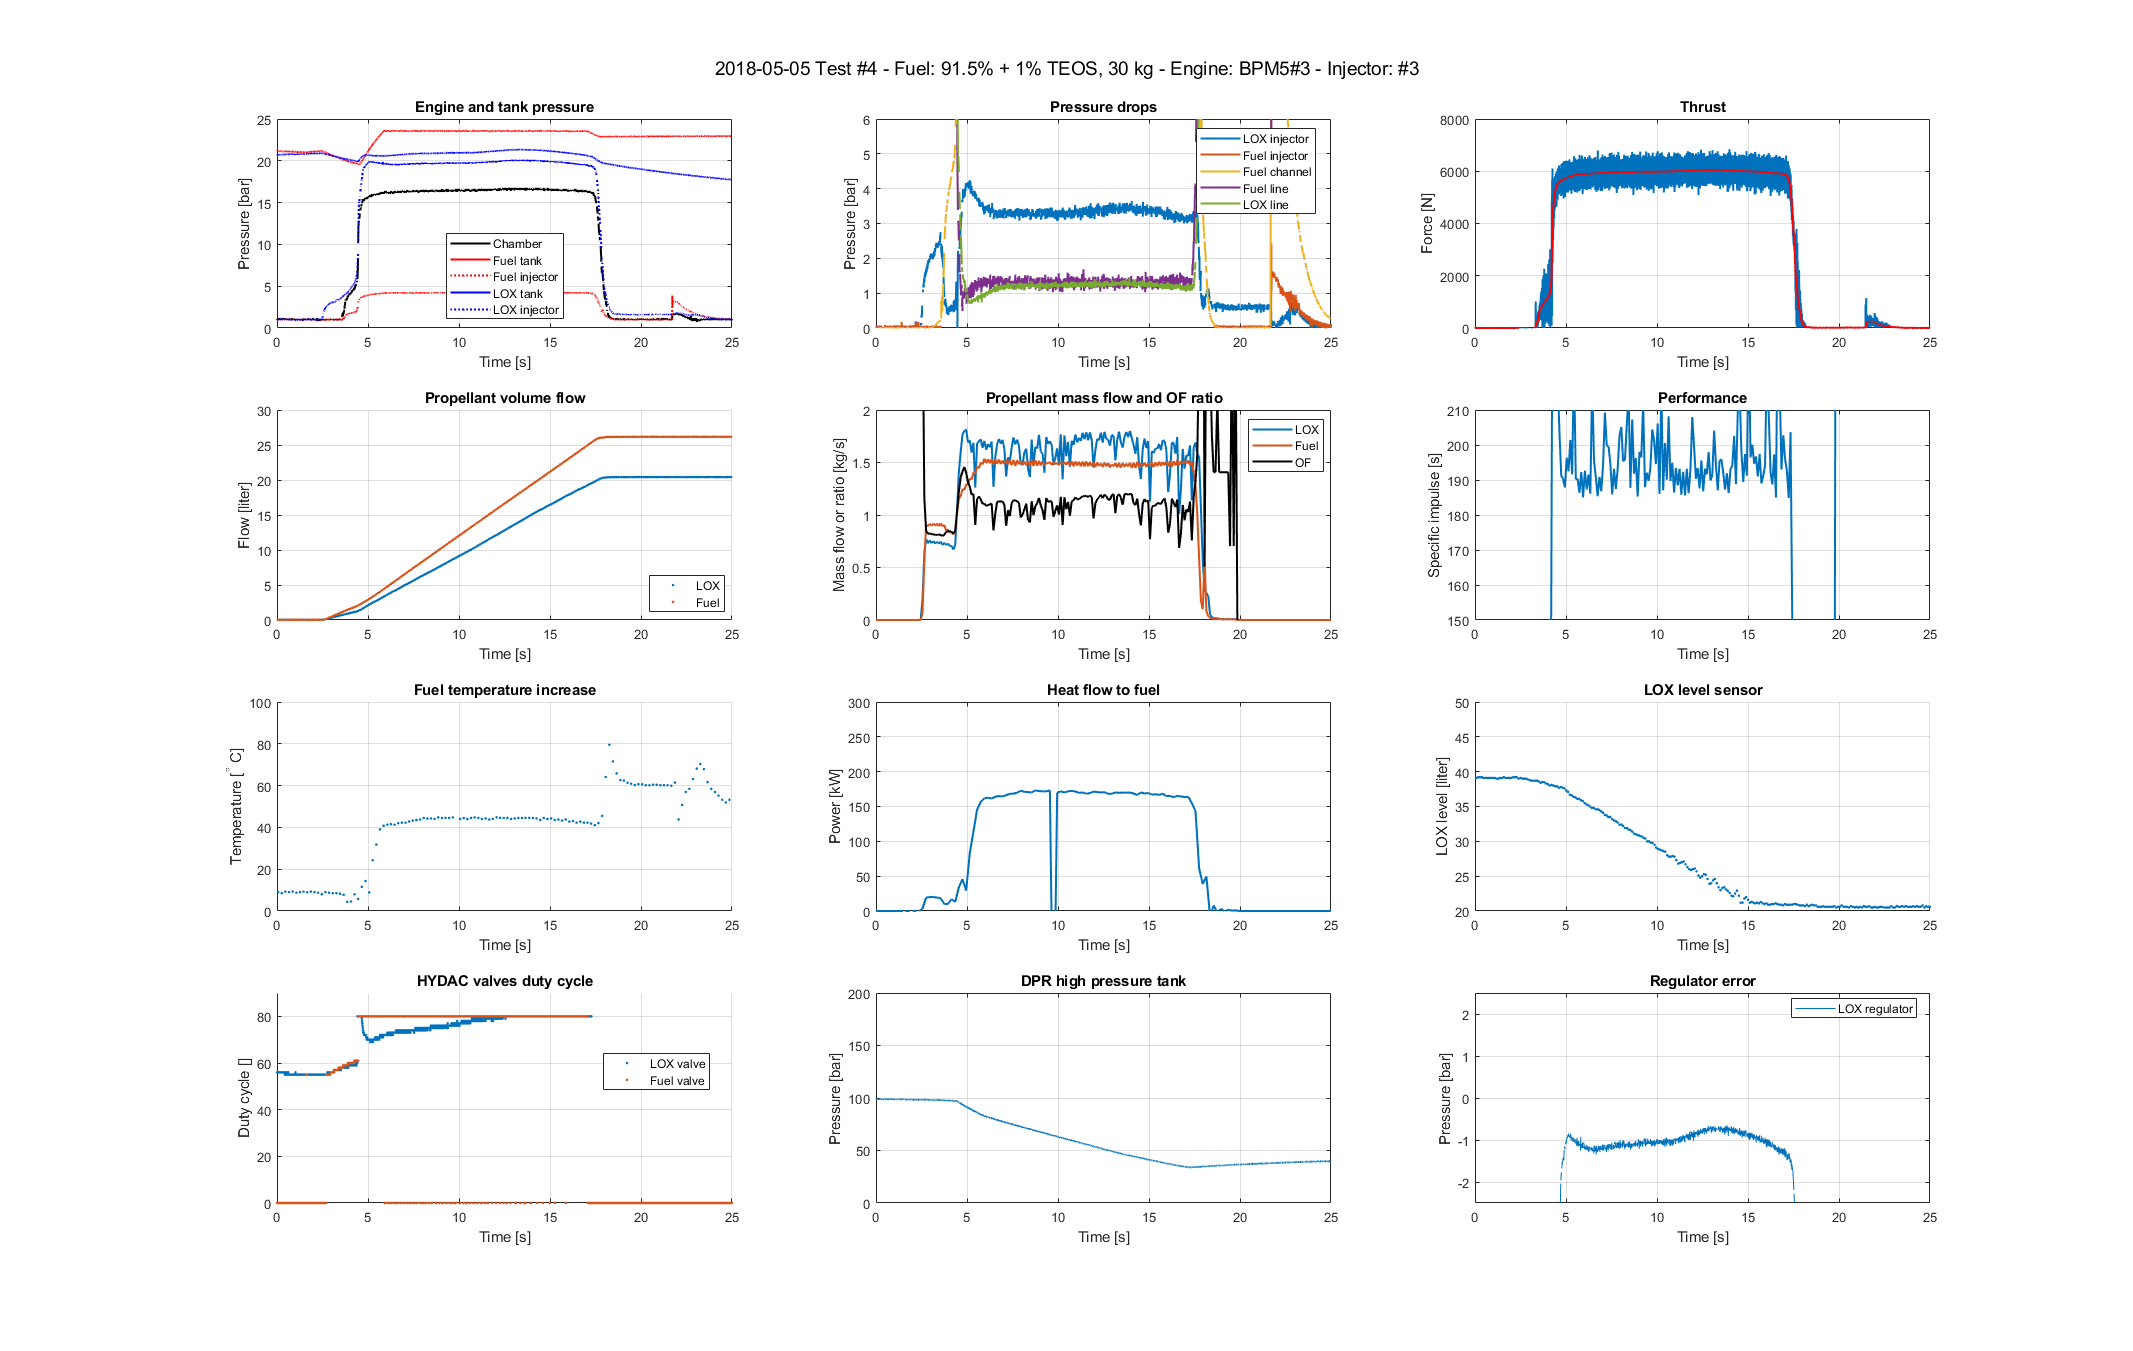
Engine data from Test # 4 with 91.5% ethanol + 1% TEOS.
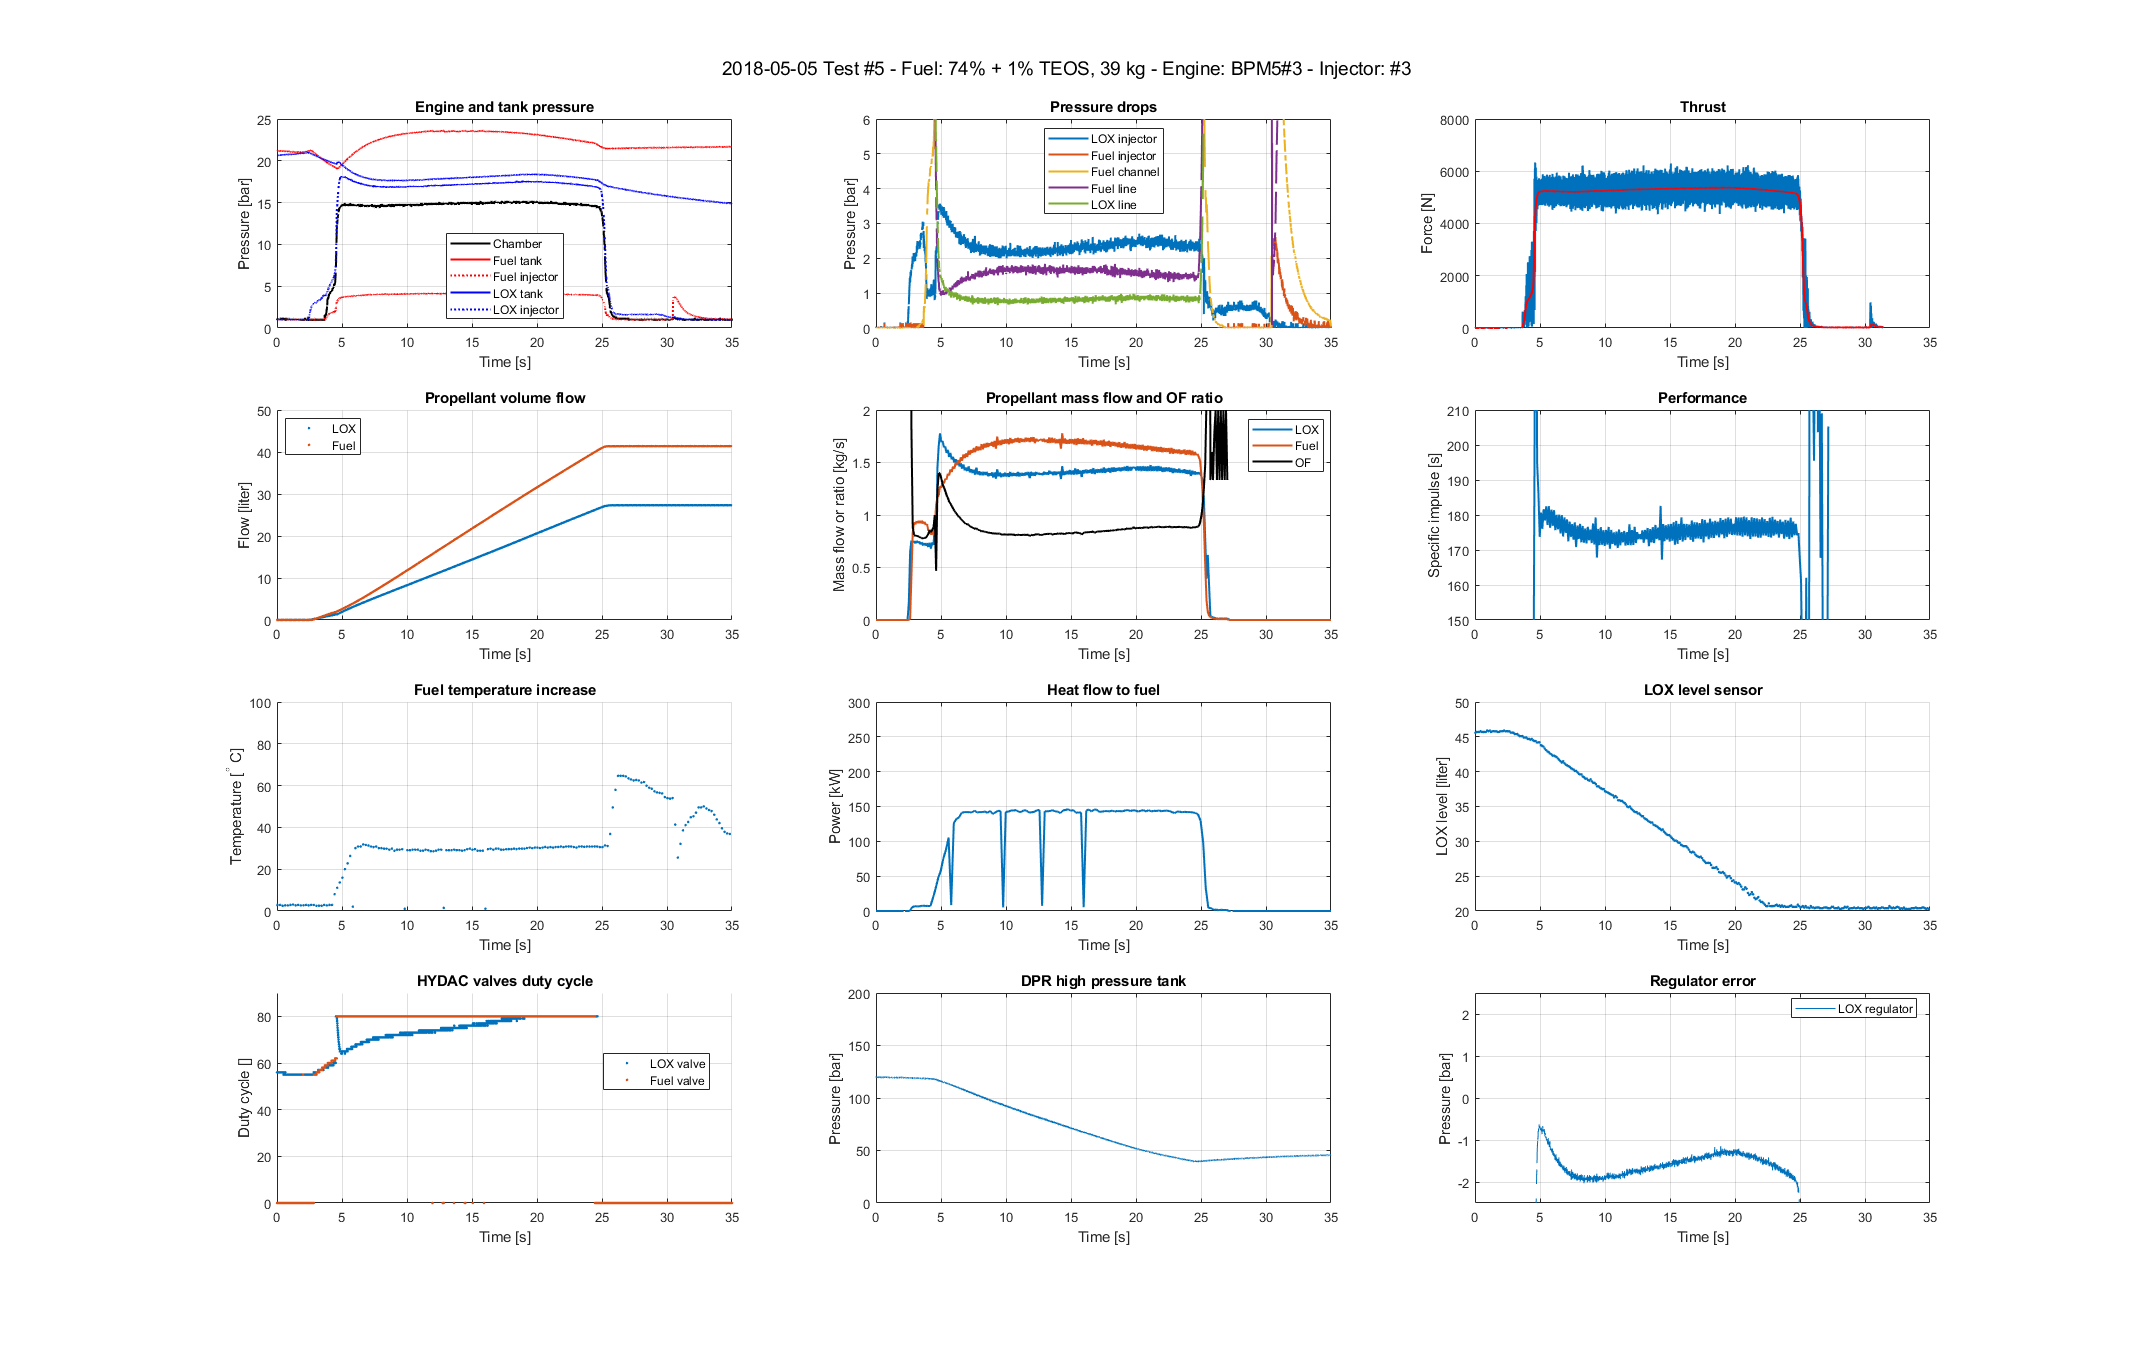
Engine data from Test # 5 with 74% ethanol + 1% TEOS.
The purpose of changing the fuel composition was to look at the resulting heat flux, i.e. to look at the temperature of the fuel in the cooling channel. I have gathered this in the following plot.

Fuel temperature and power taken up by the fuel.
The graphics are divided into three rows. In the top row, we see the temperature and power taken up by the fuel in the three tests without TEOS, i.e. with 75%, 85% and 92.5% ethanol, respectively. As expected, we see a higher temperature when we reduce the content of water. We go from a temperature rise of approx. 40 degrees for the regular 75% mixture and 54 degrees for 85% and 65 degrees for 92.5%. I have not calculated much on the expected temperature in advance, but the numbers do not seem surprising.
Note that MECO for the two tests with 85% and 92.5% is approximately T + 17 sec, whereas the standard mixture was run longer, namely up to approx. T + 25 sec.
The power transferred to the fuel is plotted on the right side. As seen the 75% mixture reaches about 186 kW, while the 85% mixture reaches 217 kW and 92.5% ethanol reaches 238 kW.
So far so good. What happens when we add TEOS? Let’s see in row two. Here we have compared the 75% mixture with the corresponding concentration with 1% TEOS. We see that the temperature rise with TEOS levels of to a constant level sooner and it is only 30 degrees! The estimated power taken up by the fuel is 143 kW, a reduction of 23%!
Looking at the bottom row we see a comparison of 92.5% with and without TEOS. Here we see the temperature rise go from 65 degrees to 44 degrees when we add TEOS. Similarly, we see the power go from 238 kW to 171 kW, a drop of 28%!
The comparison for the 75% mixture, however, is slightly disturbed by a lower chamber pressure in the TEOS test, running at 15.2 bar versus 16.4 bar. In addition, the OF ratio was terribly low, down to 0.9. Thus the result is affected by all of these factors.
For the 92.5% mixture, however, the case is different. Here the chamber pressures were the same and the OF ratios were almost the same, so here we see a real reduction in heat transport from combustion gases and to the chamber wall up to 30%. It’s quite massive and really something we can use in the design of BPM100.
With these fantastic test results we now have a really great understanding of the effect of adding TEOS. This is something we can actively use in the design of BPM100. Currently the BPM100 design is slightly on standby, until the launch of Nexø II this summer, all hands at CS are occupied by launch preparations. After launching Nexø II we will start working on the first test injector elements for the BPM100 engine


1 Comment
Soundsolutionsam1.Com · 13th November 2018 at 10:36 am
I enjoy the report
Comments are closed.