Dear readers,
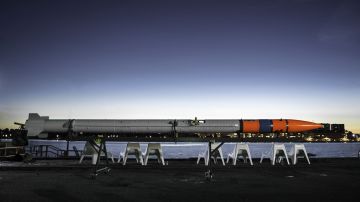
On May 5, we tested our BPM5 engine in our test stand at our workshop in Copenhagen. The setup was a bit more audience-friendly this time and many had chosen to come by and hear the engine roar. See some of our photos from the test here.
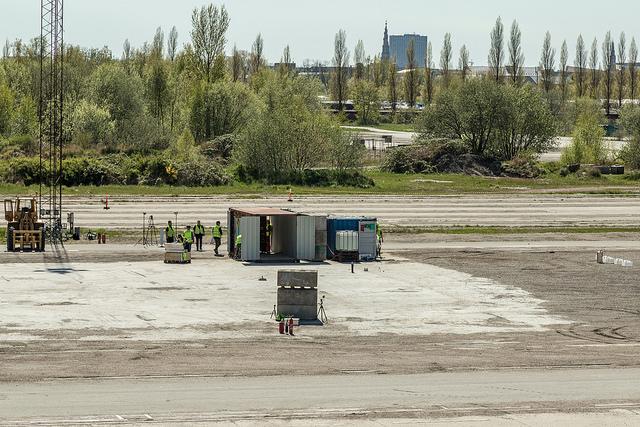
The test stand was moved to the large area in front of S2. Foto: Mads Stenfatt.
The main purpose of the test was to verify the updated software in the Engine Controller. As previously written, we have implemented a new feature in the Nexø II pressure control system.
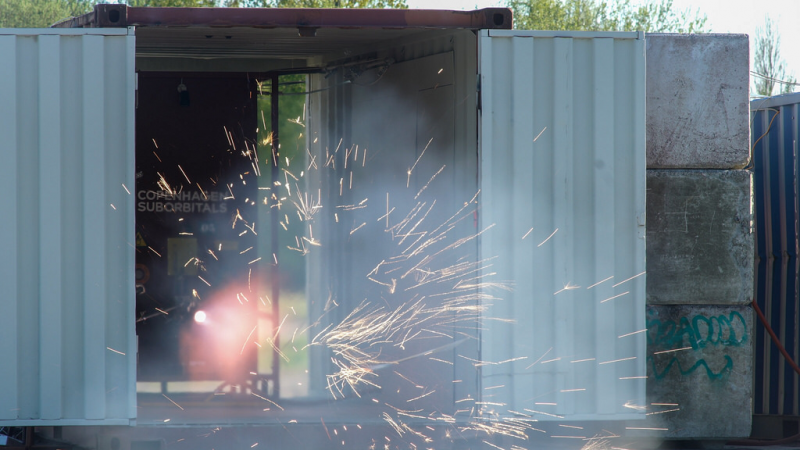
BPM5 roars again. Foto: Carsten Olsen.
In short, the updated code worked as intended, we even (inadvertently) tested a security feature, more about that in a minute. Let’s look at the data from the first test of the day.

Data from Saturday’s first test, the main purpose of which was to verify the function of the Engine Controller. Grafik: Thomas Pedersen.
Data overload? Don’t worry, we’ll take it step by step. The first plot is tank pressure, injector pressure and chamber pressure. The first thing you may notice is a chamber pressure of 16 bar. Regular readers of the blogs will know that our BPM-5 engine should nominally have a chamber pressure of 15 bar, so what’s going on? The answer is in the graph with the fuel tank pressure, which is seen to be stable at about 23.5 bar. It’s way too high … It should be around 20 bars. Just as it is right before the engine goes into mainstage around T + 5 sec. At the transition to mainstage, the pressure in the fuel tank immediately rises to the 23.5 bar, which is done by the DPR control system. But how can I say that the DPR control system worked correctly when we hit a pressure that is about 3.5 bar too high?
The DPR control system receives input from a pressure sensor in the injector (at least after transition to mainstage). For the fuel tank it is obviously the pressure from the fuel side of the injector. It is seen plotted as the red line around 4 bar. The engine controller has thus received an input that says that the pressure in the fuel side of the injector is 4 bar. This is of course not correct, it was between 17 and 18 bar, but the sensor input was approx. 4 bar. Thus, the DPR control has increased the pressure in the fuel tank up to its maximum permissible limit, which was defined as 23.5 bar. The DPR code has performed as it should. It increased the pressure in the fuel tank to bring the fuel pressure in the injector up to around 17-18 bar. Though it didn’t reach it before it hit a safety limit of 23.5 bar.
Why is the sensor input from the fuel side of the injector to low? Well, it turns out that instead of installing a 40 bar sensor a 250 bar sensor was mounted … Thus, the gain programmed into the Engine Controller was way too low. A human error which we need to find a way to eliminate in the future. The good thing here is that we tested the safety feature and it worked as it should. This also means that we ran the test with a wrong fuel pressure and thus ran with more fuel than desired and thus a low OF-ratio.
On the other hand, if we look at the LOX side in the same plot, it looks much better. With a correct sensor mounted, we see that the pressure in the LOX tank is about 19.6 bar, it’s almost perfect. So, the LOX controller has performed almost perfect. I have included the error of the LOX controller, the difference between current and set pressure as the plot in the bottom right. As we can see, we have a maximum error (under mainstage) of 0.2 bar running towards 0 around MECO, it’s perfect!
If we mount the sensors correctly, we’re confident that the fuel side will perform in the same way. And so, we believe that the code, despite the test’s errors, is validated sufficiently. However, we will review the Nexø II rocket again to make sure that all sensors are properly positioned and that the Engine Controller is programmed with the correct gain and offset for each sensor.
Let’s move on to the next graph. It shows a variety of pressure drops in the system, both a pressure drop in the pipes between the tank and the engine and the pressure drop across the injector. All this is important information when aiming for a specific chamber pressure. The 3rd graph shows the force of the engine. As we ran with a little higher chamber pressure than planned, we end up just with a force just below 6000 N!
If we continue to the second row, we first see the volume flow from the two flow sensors and then mass flow and OF-ratio based on the volume flow. As seen, the fuel flow is higher than intended and the OF-ratio ends at 1.
The last graph in this row shows a performance measurement, namely the engine’s specific impulse. Here we are between 180 and 190 seconds which is quite good the low OF-ratio taken into account. With a correct OF-ratio we could get it up to about 200 seconds.
In row three, we see the temperature rise in the fuel, which is used to cool the engine before the fuel is burned. We see that we end up with a temperature rise of just under 40 degrees. Normally, we are slightly higher about 45 degrees, but it can be attributed to the low OF-ratio. The next graph is directly derived from the rise in temperature and the mass flow of fuel, it shows the amount of power the fuel absorbs through its cooling channel. At MECO it’s about 180 kW that the fuel removes from the chamber wall (!).
The last graph in this row we do not use much in the analysis of the engine performance. It shows the amount of LOX in the tank and the curve comes from the fine capacitive LOX sensor that Emil and Meincke have built. Yes, I have mentioned it before, but the sensor is so significant an upgrade of the test stand that it deserves to be mentioned again. It’s simply essential when loading LOX on one’s test stand. Or rocket for that matter. Nexø II is of course equipped with a flight version of this sensor.
In the last row, we first see the duty cycle (or relative opening time) of our HYDAC DPR valves. As can be seen, the fuel valve is quickly opened completely, and it then alternates between completely open and completely closed in the DPR control systems attempt to get the pressure up and then reaching the safety limit of 23.5 bar. On the LOX side, we see a more expected graph, where the valve goes to full open around MECO.
The next graph in the row is the pressure in the DPR tank, which in the test stand consists of two 12-liter diving tanks. Before the test starts they are pressurized to 190 bars with helium. A large part of the gas is consumed between T-20 and T0 sec, where the fuel tanks are pressurized to 20 bars. The declining pressure in the tank is the reason why the DPR valves (in this case the DPR valve on the LOX side) slowly move towards completely open to deliver gas sufficiently. The last graph is, as mentioned earlier, the error on the DPR control, ie the difference between the actual and the desired pressure in the injector.
Disregarding the unfortunate sensor confusion, it is a fully approved test that validates Nexø II’s Engine Controller to be ready to fly.
However, that was not the only test we performed last Saturday. Now that we had the test stand ready we might as well experiment a little and so we did. We performed a total of 5 burns totaling approx. 85 second operation (mainstage) and provided a total impulse of 476 kNs with BPM-5 #3. The secondary test program consisted of experimenting with different fuel mixtures. Our default fuel mixture is 75% ethanol and 25% water. To experiment a bit and get input for the design of the BPM100 engine, we also tested 85% ethanol, 92.5% ethanol, and 92.5% added TEOS and 75% added TEOS to see if this should have a pronounced effect on heat transfer to the chamber wall.
However, that is a story in itself, so I want to end today’s blog here and return with exciting results about this next week. As a small cliffhanger, I will just show a picture of the engine after a burn with TEOS added to the ethanol. As seen, the entire inside is coated with a fine white layer of silicon dioxide.
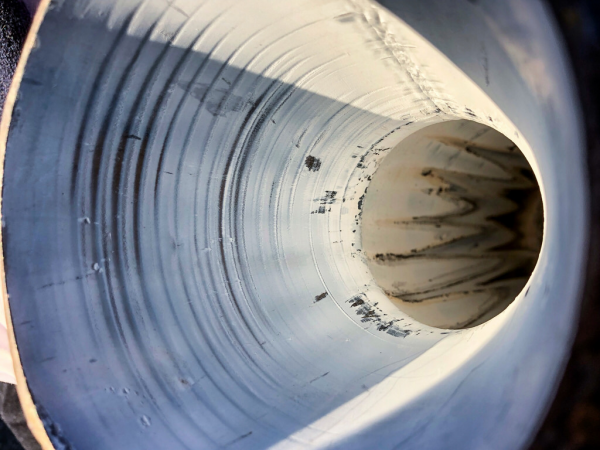
After a 1% TEOS run, the engine is coated with a fine layer of SiO2. Foto: Carsten Olsen.


9 Comments
Mark Harder · 23rd May 2018 at 12:48 pm
What’s TEOS? Some kind of silane? Can you tell us some more about it, like why do you add it to your fuel. Do you have a video of the test taking place? thanks.
Rasmus Ragdestein · 24th May 2018 at 7:55 pm
Hi Mark.
Here is (a little old) video about TEOS and why we use it:
https://www.youtube.com/watch?v=oeWc1LbZXtw
And a video from the test day is here:
https://www.youtube.com/watch?v=koSpj1rMdYk
Bernhard Kuemel · 24th May 2018 at 1:09 am
I posted the newsletter to ircs://chat.freenode.net:6697/##space . Would be cool if some of you dropped by there occasionally :). Use an IRC client or https://webchat.freenode.net/ . I’m darsie there.
Bryan Garcia · 25th May 2018 at 3:30 am
What is the cause of such a low specific impulse? Could it be due to the dilution of the ethanol, or is it possible that it is due to a design anomaly?
Jacob Larsen · 25th May 2018 at 9:03 pm
Hi Bryan,
What is a ‘low’ and ‘high’ specific impulse in your opinion? An ISP of approximately 190 at a fairly non-optimum O/F ratio of ~1.0 is not half bad?
Adrian · 7th February 2020 at 11:22 am
Hi,
What type of pomp you use? Your own or ready to use?
Sarunas Kazlauskas · 7th February 2020 at 4:22 pm
No pumps, it’s a pressure fed system.
Travis · 1st April 2021 at 3:42 pm
Was this with the shower head injector plate? How many liters per second of fuel and oxygen did it inject at 20bar?
Results of our latest BPM-5 rocket engine burns – Space Today · 23rd May 2018 at 12:19 pm
[…] https://copenhagensuborbitals.com/data-from-our-latest-bpm-5-rocket-engine-test […]
Comments are closed.